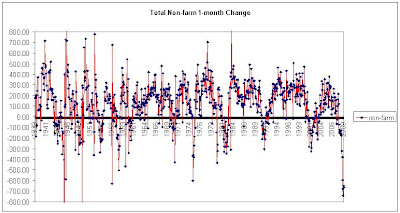
-"What?"
Inaudible Dialogue.
-"Comment?"
Pause.
-"Eh...Well, um, as you can see, things were worse in 1945..."
.............................................................................

All raw data used for the charts were retrieved in April 2009 from http://www.federalreserve.gov/